ai @ wvu
Modeling Intelligence Lab ("the MILL")
Saturday, October 27, 2012
Looking at the data
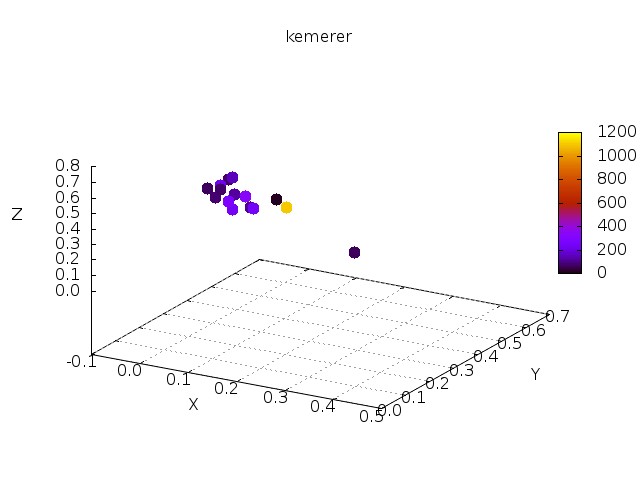
These figures are hypercube projections of effort data sets.
The first side was picked at random and runs between any two corners 0,1.
After than, side N=2,3,4... was built by picking a point whose sum of the distances to corners 0,1,...N-1 is maximal.
No comments:
Post a Comment
Newer Post
Older Post
Home
Subscribe to:
Post Comments (Atom)


No comments:
Post a Comment