Tuesday, September 27, 2011

Current Progress of Lisp NSGA-II

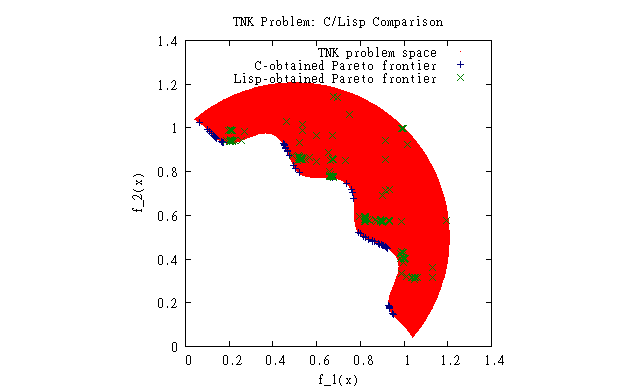
This was the first comparison between the C version and my version. I would have made a new graph, but I somehow lost the C frontier data. I saw that something was very wrong, so I have spent a lot of time trying to fix it. This is as close as I've gotten thus far:

The results are closer, but something is still missing.

How to find data for effort estimation

Which-2 Function Optimizer Early results

Primarily, we are going to look at the Fonseca data set.

The final curve I was able to generate after 10 generations of running which looks like this:

http://unbox.org/stuff/var/will/frontierfinder/ml/generations/fonseca9.png


It is worth noting that the frontier does not approach f1(x)=0 or f2(x) = 0. Also, on the bottom (leg) of the curve, we see less consistency. This did not seem to improve with future generations.

The overall progression of the generations is here:

http://unbox.org/stuff/var/will/frontierfinder/ml/generations/fonseca1.png


After generation 5, very little seems to change other than a slight change between generations 6 to 9:

http://unbox.org/stuff/var/will/frontierfinder/ml/generations/fonseca.png

Numeric results have not yet been calculated.

Monday, September 26, 2011

Paper Reviews

Kernel paper is good to go with 10 pages of replies. The latest pdf is here.

TSE paper (active learning) major review is under construction here.

Tuesday, September 13, 2011

CITRE Data Analysis

Not shockingly, the field that is an order of magnitude larger than the others most affects the data


By comparison, when looking at the other fields, few of the percentages were substantially different from 20% (if, within a class, each of the possible values had a 20% distribution, it would mean true random distribution)

Data  (Big file)

Insofar as progress into Which and NSGA-2, I've made progress, though due to illness, not as much as I would like. Hopefully to complete both (or at least 1) by next week with some results.

Monday, September 12, 2011

First Stab at NSGA-2 Optimization

I am working on a modified NSGA-2 to converge on the Pareto frontier in fewer generations than the standard version.  My idea is to use clustering to determine the region of independent variable space that is the most promising of those tried in a given generation.  By knowing the best spatial region, it should be possible to generate solutions in that region to gain more information than could be gathered breeding initial poor solutions.

My first attempt took a rather simple approach.  I made it so that the fast non-dominated sort (FNDS) chose some percentage of the parents for the next generation, and the rest were generated within the most promising space as determined by the above sort.  This space was determined by clustering solutions by reducing the standard deviations of the independent variables down to a minimum cluster size of 20, then selecting the cluster that had the lowest mean frontier rank.

This attempt seems to have some promise.  Here is a graph showing the baseline performance of the standard NSGA-2 on the Fonseca study:


This is a graph of the two objective scores for all members of the first-ranked frontier for each generation.  By generation 20 (far right), NSGA-2 has found a very nice distribution of answers across the Pareto frontier.  The first generation that looks close enough to me is generation 14.  Note how the first few generations are rather noisy; it isn't until generation 8 that the solutions starts to mostly lie on the Pareto frontier.

As a counterpoint, here is a like graph of my modified NSGA-2.  For this run, FNDS selects 80% of the parents, and the remaining 20% are generated from the best cluster:


First, note how the generations converge toward the frontier more rapidly than the baseline.  Fewer of the solutions for the initial generations are far away from the Pareto frontier, and by generation 6, the Pareto frontier is outlined almost as strongly as it is in generation 8 from the baseline.

There seem to be diminishing returns from this approach, however.  After the baseline NSGA-2 has "discovered" the Pareto frontier, it smoothly converges onto it and distributes solutions across it rather nicely.  My modified NSGA-2 seems to be injecting noise that keeps it from converging smoothly across the solution space.  This is probably because NSGA-2 is designed to distribute solutions across the Frontier, whereas my current clustering approach searches only one part of it.  Furthermore, no adjustments are currently made to account for the algorithm getting closer to the answer, so good solutions are getting replaced by guesses made by the clusterer.

For the next step, I will explore ways to make the clusterer explore all the promising spaces as opposed to just the best one, and also to dynamically adjust the ratio of FSDN-selected parents to cluster-selected parents based upon the proximity to the Pareto frontier.

Wrapping up after the quals

1. ESEM 2011 Talk: Version1 of our presentation is here.
2. The papers waiting for revision are:

  • Active Learning Paper at TSE (major changes (for 2 goods, 1 excellent) due 5th December 2011)
  • Kernel Paper at ESEM (minor changes due 29th September 2011)
  • Ranking Stability Paper at ASE (major-awaiting the return from TSE about ensemble paper)
  • Bias-Variance Paper (new statistical test)
  • Hong-Kong paper (waiting for submission after the reviews of Dr. Keung & Dr. Menzies)
3. Design of experiments for unsupervised feature selection. My action-plan is:
  • Find a list of 10+ unsupervised feature selectors
  • See this work as a follow-up or complement of the active learning paper, i.e.
  • Use the same datasets as the active learning paper
  • Run only feature selectors and see which datasets can give the same performance with less features. This will show if it works at all.
  • If prior succeeds, then run active learner (with k=1) followed by successful feature selectors. Then change this order and get another run. Compare performance to using the whole dataset and see if feature selection and active learning can complement one another.
4. Design of experiment for the ET test. My action plan for the paper is:
  • Reading the TSE paper for better understanding
  • Formulating the ET test in a formal manner
  • Replicating the ASE paper to confirm/refute the ranking changes
  • If the previous one succeeds, then building ensembles to see if the ET test outcomes are confirmed by successful multi-methods (???)

Monday, September 5, 2011

Game AI vs Traditional AI

Very recent topic about Traditional AI and Game AI, and what is best for entertainment in games.

http://www.ai-blog.net/archives/000183.html
http://altdevblogaday.com/2011/07/11/students-game-ai-vs-traditional-ai/

We are still very far behind in terms of "good AI"; Game developers tend to avoid Traditional AI

"Game Developers don't get paid to be clever" - most of the stuff in games today are just tricks, smokes and mirrors, designed to increase believability and make for better games.

The important part is to make a fun and compelling game. Traditional AI takes lots of time and memory, and it doesn't even get used much.

Dungeon Game


Dungeon Game is updated with a simple competitive game play. You need to find the key and then take it to the exit (faster than the Agent.)

We want the Agent to play like a human, so that the game is fair, and as fun as it can be.

The Algorithm powering the Agent is based simply on how I think humans explore. However, data is forthcoming on how humans really explore.


Screenshot: The Agent wins.