Tuesday, April 19, 2011
Monday, April 18, 2011
Contrast Sets
I've got which2n ported from Will1 for a baseline result. It's spitting out results like THIS.

Also, I've figured out how to embed an on_release event to the matplotlib canvas inside of my wxpython rig so that we can record clicks and display contrasts for selected regions. There will probably be 1,000,000,000 variations of the contrasts that we show (or that the user would like to see. THIS against ALL, THIS against THOSE, THIS against THAT...)
I'm having some issues with which2 and very small sections of instances so the display is waiting on that.

Planner Demo & Lua Search Algorithms
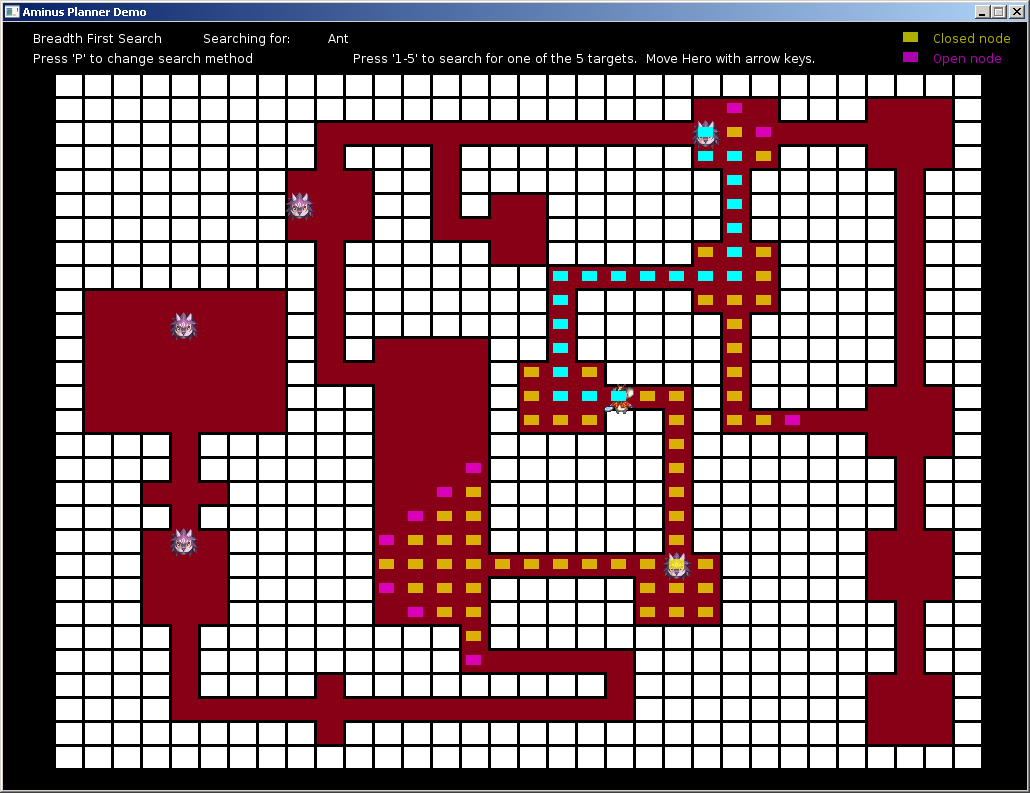
Download demo from here: https://sites.google.com/site/tanzastic/research/planner.love
Need to download LOVE from http://love2d.org, (and install; simple, takes 30 seconds) then you can just double-click to launch planner.love
- Simple demo in lua, using various search methods.
- Map and sprites based on a popular game (that I'm active with.)
Tuesday, April 12, 2011
Noise Reduction in Defect Datasets Using Cliff
No subsampling applied.
http://www.unbox.org/wisp/var/kel/cliff-effort/results6/gnuplot/40/true-chart.pdf
http://www.unbox.org/wisp/var/kel/cliff-effort/results6/gnuplot/40/false-chart.pdf
Subsampling applied (all (N) defective class and N non-defective.
http://www.unbox.org/wisp/var/kel/cliff-effort/SubSamResults3/gnuplot/40/true-chart.pdf
http://www.unbox.org/wisp/var/kel/cliff-effort/SubSamResults3/gnuplot/40/false-chart.pdf
Tasks this week:
Grammatech report (by Thursday morning at the very latest)
IDEA rig for summer.
Monday, April 11, 2011
Tuesday, April 5, 2011
Histograms and EMD

Taken from Wikipedia, the source of all knowledge and truth:
"The earth mover's distance (EMD) is a measure of the distance between two probability distributions over a region D. Informally, if the distributions are interpreted as two different ways of piling up a certain amount of dirt over the region D, the EMD is the minimum cost of turning one pile into the other; where the cost is assumed to be amount of dirt moved times the distance by which it is moved."


Subscribe to:
Posts (Atom)