Tuesday, August 28, 2012

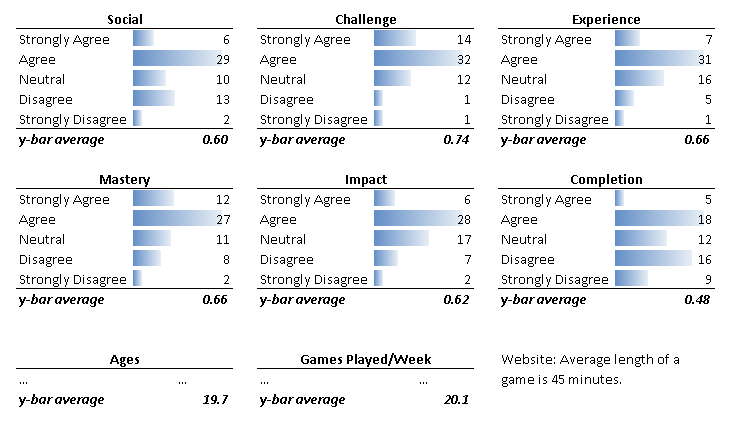
pom2 & fun in games
pom2 graph: http://i.imgur.com/ffATu.png
Plans for fun games:
- Prepare cog. tests: i.e. What dungeon parameters lead to highest user play time
- Collect data: game dumps user data to server
- - - Dungeon parameters used, total play time, explore ratios, speed of movement, items collected, etc
- Analyze data: keys2?
Plans for fun games:
- Prepare cog. tests: i.e. What dungeon parameters lead to highest user play time
- Collect data: game dumps user data to server
- - - Dungeon parameters used, total play time, explore ratios, speed of movement, items collected, etc
- Analyze data: keys2?
Monday, August 27, 2012
Tuesday, August 21, 2012
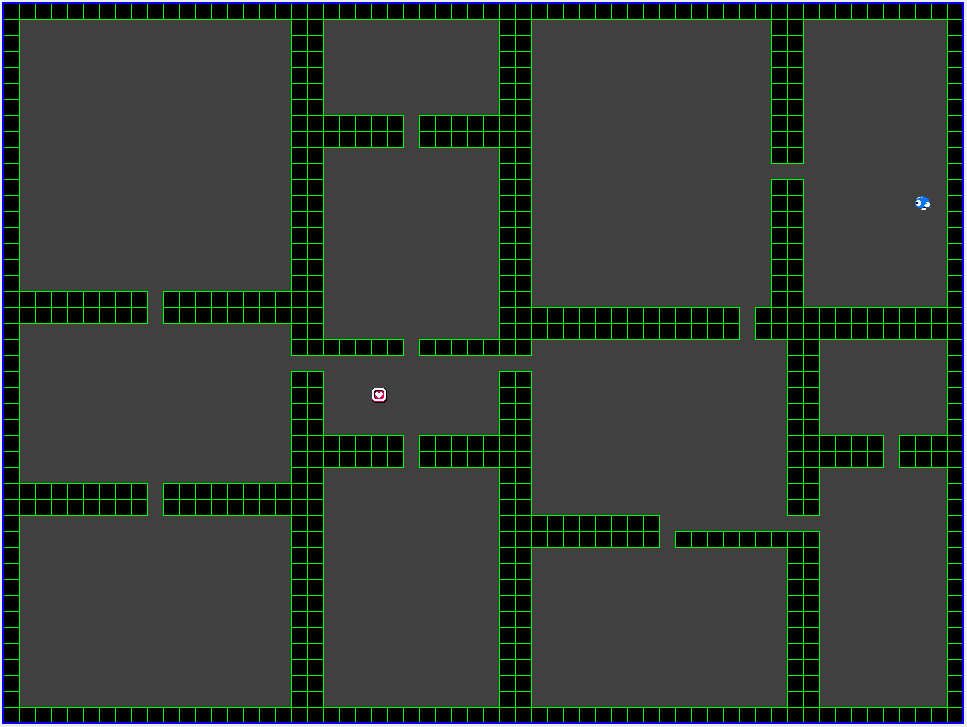
Maze Game & Turing Test of AI
AiMazed2D Project (Java Jar download below):
https://sites.google.com/site/tanzastic/research/AiMazed2D.jar?attredirects=0&d=1
Tasks this week:
1. Video record humans playing the game
2. Video record AI playing the game
3. Devise/research way to score results of formal turing test across gathered sample space from (1 & 2)
Tasks later down road:
1. Improve score of turing test. (Study differences between humans and AI videos above)
* Most prominently: humans have decision delays that must be imitated by the AI
https://sites.google.com/site/tanzastic/research/AiMazed2D.jar?attredirects=0&d=1
Tasks this week:
1. Video record humans playing the game
2. Video record AI playing the game
3. Devise/research way to score results of formal turing test across gathered sample space from (1 & 2)
Tasks later down road:
1. Improve score of turing test. (Study differences between humans and AI videos above)
* Most prominently: humans have decision delays that must be imitated by the AI
Monday, August 20, 2012
NSF Workshop: Planning Future Directions in Artificial Intelligence and Software Engineering (AISE'12)
NSF Workshop: Planning Future Directions in
Artificial Intelligence and Software Engineering
(AISE'12)
Tim Menzies, Rachel Harrison, Sol Greenspan
NSF is sponsoring a one-day workshop to consider how ideas and technologies from Artificial Intelligence (AI) can help achieve the goals of Software Engineering (SE). The purpose of the workshop is to gather researchers from both communities who have a common interest in leveraging AI research to advance SE. The converse -- improving SE for AI applications and systems -- is also in scope. The objective is to assemble a meeting of researchers from both communities to formulate a fruitful research agenda. After the workshop, the organizers will invite some attendees to co-author a report entitled Future Directions in Software Engineering and Artificial Intelligence Research.
Participation is by invitation only. Prospective participants should submit a research vision statement written from one or more of the following perspectives:
Tim Menzies, Rachel Harrison, Sol Greenspan
NSF is sponsoring a one-day workshop to consider how ideas and technologies from Artificial Intelligence (AI) can help achieve the goals of Software Engineering (SE). The purpose of the workshop is to gather researchers from both communities who have a common interest in leveraging AI research to advance SE. The converse -- improving SE for AI applications and systems -- is also in scope. The objective is to assemble a meeting of researchers from both communities to formulate a fruitful research agenda. After the workshop, the organizers will invite some attendees to co-author a report entitled Future Directions in Software Engineering and Artificial Intelligence Research.
Participation is by invitation only. Prospective participants should submit a research vision statement written from one or more of the following perspectives:
- Improving SE through AI -- including but not limited to knowledge acquisition / representation / reasoning, agents, machine learning, machine-human interaction, planning and search, natural language understanding, problem solving and decision-making, understanding and automation of human cognitive tasks, AI programming languages, reasoning about uncertainty, new logics, statistical reasoning, etc.
- Applying AI to SE activities -- including but not limited to requirements, design, specification, traceability, program understanding, model-driven development, testing and quality assurance, domain-specific software engineering, adaptive systems, software evolution, etc.
- SE for AI -- including but not limited to AI programming languages, program derivation techniques in AI domains, platforms and programmability, software architectures, rapid prototyping and scripting for AI techniques, software engineering infrastructure for reflective and self-sustaining systems, etc.
On the Value of User Preferences in Search-Based Software Engineering: A Case Study in Software Product Lines
On the Value of User Preferences in Search-Based
Software Engineering: A Case Study in Software
Product Lines
Abdel Salam Sayyad Tim Menzies Hany Ammar
Software design is a process of trading off competing objectives. If the user objective space is rich, then we use optimizers that can fully exploit that richness. For example, this study configures software product lines (expressed as feature maps) using various search-based software engineering methods. As we increase the number of optimization objectives, we find that methods in widespread use (e.g. NSGA-II, SPEA2) perform much worse than IBEA (Indicator-Based Evolutionary Algorithm). IBEA works best since it makes most use of user preference knowledge. Hence it does better on the standard measures (hypervolume and spread) but it also generates far more products with 0% violations of domain constraints. Our conclusion is that we need to change our methods for search-based software engineering- particularly when studying complex decision spaces.
Download
Abdel Salam Sayyad Tim Menzies Hany Ammar
Software design is a process of trading off competing objectives. If the user objective space is rich, then we use optimizers that can fully exploit that richness. For example, this study configures software product lines (expressed as feature maps) using various search-based software engineering methods. As we increase the number of optimization objectives, we find that methods in widespread use (e.g. NSGA-II, SPEA2) perform much worse than IBEA (Indicator-Based Evolutionary Algorithm). IBEA works best since it makes most use of user preference knowledge. Hence it does better on the standard measures (hypervolume and spread) but it also generates far more products with 0% violations of domain constraints. Our conclusion is that we need to change our methods for search-based software engineering- particularly when studying complex decision spaces.
Download
Better Cross Company Defect Prediction
Fayola Peters, Tim Menzies, Andrian Marcus
Abstract— How can we find data for quality prediction? Early
in the lifecycle, projects may lack the data needed to build such
predictors. Prior work assumed that relevant training data was
found nearest to the local project. But is this the best approach?
This paper introduces the Peters filter that is based on the
following conjecture. When local project data is scarce, there is
more information in other projects than locally. Accordinging, this
filter selects training data via the structure of the other projects.
We tested the Peters filter on 21 small data set looking
for training data in 35 larger data sets. In the majority case
(67%), the Peters filter builds much better defect predictors that
the current-state-of-the-art methods. Hence, we recommend the
Peters filter for cross-company learning.
Download
Download
Thursday, August 9, 2012
Bromacil Cumulative Percentage by round
Atrazine Cumulative Percentage by round
Hmm, can you predict the cluster of the target? Much simpler once the nearest neighbor heuristic was applied.
Atrazine Cumulative Percentage by round
Hmm, can you predict the cluster of the target? Much simpler once the nearest neighbor heuristic was applied.
Thursday, July 26, 2012
Erin Thurs 7-26
Worked example of Ordonez distance algorithm
Code snippet - shows code and marks the place where I have verified the algorithm
pseudoCode up to verified line
awk code where I'm hung up
must do: decide on a class the meets requirements, hard as there are very few open
Code snippet - shows code and marks the place where I have verified the algorithm
pseudoCode up to verified line
awk code where I'm hung up
must do: decide on a class the meets requirements, hard as there are very few open
Tuesday, July 24, 2012
Erin's To Dos
Ellington NN clustering, preliminary
Continue working on Binary Sparse NN implementation
Think centroids need to be binary with stdDev instead of averages of the points.
Nearly every instance is clustered, and the lack of StdDev cutoff is not identifying unknown instances
Double check methods to make sure they are working as I think they should
Start GRE studying - exam July 31
Schedule
Ellington NN clustering, preliminary
Continue working on Binary Sparse NN implementation
Think centroids need to be binary with stdDev instead of averages of the points.
Nearly every instance is clustered, and the lack of StdDev cutoff is not identifying unknown instances
Double check methods to make sure they are working as I think they should
Start GRE studying - exam July 31
Schedule
Thursday, July 19, 2012
POM
POM Learner Results:
Software Project Performance Metrics: http://i.imgur.com/ERu9M.png
Learner Metrics: http://i.imgur.com/AJoq1.png
Software Project Performance Metrics: http://i.imgur.com/ERu9M.png
Learner Metrics: http://i.imgur.com/AJoq1.png
Cluster SA results
Results/Comparisons:
https://docs.google.com/document/d/1E0lwTCm-GDijJUjmfu_aA0EwuLCkm2B2rikJ2hoh-MM/edit
How to measure success/compare methods?
In the NSGA-II paper[1], there were two performance measures they used, neither were AUC. Since these models were widely used, they used 500 known, evenly distributed, points on the Pareto to measure the average distance from each resultant point to the Pareto, which was the first metric. The second metric was a measure of spread across the Pareto of the obtained solutions, calculated with a given algorithm.
REFERENCES:
[1] Kalyanmoy Deb, Associate Member, IEEE, Amrit Pratap, Sameer Agarwal, and T. Meyarivan, A Fast and Elitist Multiobjective Genetic Algorithm: NSGA-II, IEEE TRANSACTIONS ON EVOLUTIONARY COMPUTATION, VOL. 6, NO. 2, APRIL 2002
https://docs.google.com/document/d/1E0lwTCm-GDijJUjmfu_aA0EwuLCkm2B2rikJ2hoh-MM/edit
How to measure success/compare methods?
In the NSGA-II paper[1], there were two performance measures they used, neither were AUC. Since these models were widely used, they used 500 known, evenly distributed, points on the Pareto to measure the average distance from each resultant point to the Pareto, which was the first metric. The second metric was a measure of spread across the Pareto of the obtained solutions, calculated with a given algorithm.
REFERENCES:
[1] Kalyanmoy Deb, Associate Member, IEEE, Amrit Pratap, Sameer Agarwal, and T. Meyarivan, A Fast and Elitist Multiobjective Genetic Algorithm: NSGA-II, IEEE TRANSACTIONS ON EVOLUTIONARY COMPUTATION, VOL. 6, NO. 2, APRIL 2002
Tuesday, July 17, 2012
FpFSS slides
Leverages Association Learning (FP Growth) and Clustering (EM) to create a predictive data model in an unclassified database where the number of rows and columns are similar. Model is then applied to a related time series database where cluster concentrations can be predicted for future time values.
Erin's To Dos
Leverages Association Learning (FP Growth) and Clustering (EM) to create a predictive data model in an unclassified database where the number of rows and columns are similar. Model is then applied to a related time series database where cluster concentrations can be predicted for future time values.
Erin's To Dos
Local Cluster SA
Only SA for Constr (really bad):

[1] Baseline from NSGA-II for Constr:


Other runs for SA on cluster for Constr, only dominating:


Conclusion: Running SA with clusters was much MUCH better, but could use some improvement. By limiting SA to within cluster we get points that aren't going to be on the pareto.
Up Next: DE
REFERENCES
[1] Kalyanmoy Deb, Associate Member, IEEE, Amrit Pratap, Sameer Agarwal, and T. Meyarivan, A Fast and Elitist Multiobjective Genetic Algorithm: NSGA-II, IEEE TRANSACTIONS ON EVOLUTIONARY COMPUTATION, VOL. 6, NO. 2, APRIL 2002

[1] Baseline from NSGA-II for Constr:

SA on cluster for Constr(top: all points, bottom: only dominating):


Other runs for SA on cluster for Constr, only dominating:


Conclusion: Running SA with clusters was much MUCH better, but could use some improvement. By limiting SA to within cluster we get points that aren't going to be on the pareto.
Up Next: DE
REFERENCES
[1] Kalyanmoy Deb, Associate Member, IEEE, Amrit Pratap, Sameer Agarwal, and T. Meyarivan, A Fast and Elitist Multiobjective Genetic Algorithm: NSGA-II, IEEE TRANSACTIONS ON EVOLUTIONARY COMPUTATION, VOL. 6, NO. 2, APRIL 2002
POM
Todo List: https://docs.google.com/spreadsheet/ccc?key=0AolajDUgsGZ7dGF0Y2ppYk9XS0g5aTQ3bFRVbjRXSmc
POM: Portman Owens Menzies
What is it: A software project emulator model. See how full projects which take 200 days or more complete in mere seconds in a model. Can gather variety of statistics such as days to complete, money spent, and many more. I've coded a version of it for use with a learner.
How it works: My POM model runs on Actory, which is a Finite State Machine of sorts, where each Team/Person in the development project is a different machine. We also add a project manager, and an "assigner", who's job is to decide which task is best for the team/person.
Coded in: Python
Reason for Building POM: The transitions between machines in Actory have priorities. The main goal of POM was to use a Learner (bore = best or the rest) to learn the best transition priorities in Actory.
Methodology for Learning: We run POM 1000 times to generate average statistics and then package them with the currently used (random) transition priorities. This package gets sent to the learner, which spits out some data analysis on what the best transition priorities should be. After learning the best transition priorities, we run POM again, 1000 times, and regenerate the statistics and compare them to see if any improvements were found.
Data Results: The five statistics used are as follows:
- - - days = Days to Complete Project
- - - s1 = Money per Day Spent
- - - s2 = Money per LOC
- - - s3 = Days per LOC
- - - s4 = Average time spent IDLE for a team/person
Before learning:
- - - days = 269
- - - s1 = 1240
- - - s2 = 10.25
- - - s3 = 0.0083
- - - s4 = 0.5004
After learning:
- - - days = 268
- - - s1 = 1242
- - - s2 = 10.22
- - - s3 = 0.0082
- - - s4 = 0.4001
Brookes Law: Adding members to the project at a late phase in the game will only make it later. We test this in POM by allowing team/persons to gain experience and become better coders the more they work on the project. We test the effects and prove brookes law by running POM 35 times and gathering the number of days it takes, when team/persons can be added at different phases during the completion of the project. The following chart depicts the results, and indicates a steady increase in the days when members can be added earlier in the development.
http://i.imgur.com/frqkH.png
Y Axis: Days
X Axis: (0 to 100%) Percent of the Project Completed (Teams/Persons can only be added to the project when it is this much complete)
POM: Portman Owens Menzies
What is it: A software project emulator model. See how full projects which take 200 days or more complete in mere seconds in a model. Can gather variety of statistics such as days to complete, money spent, and many more. I've coded a version of it for use with a learner.
How it works: My POM model runs on Actory, which is a Finite State Machine of sorts, where each Team/Person in the development project is a different machine. We also add a project manager, and an "assigner", who's job is to decide which task is best for the team/person.
Coded in: Python
Reason for Building POM: The transitions between machines in Actory have priorities. The main goal of POM was to use a Learner (bore = best or the rest) to learn the best transition priorities in Actory.
Methodology for Learning: We run POM 1000 times to generate average statistics and then package them with the currently used (random) transition priorities. This package gets sent to the learner, which spits out some data analysis on what the best transition priorities should be. After learning the best transition priorities, we run POM again, 1000 times, and regenerate the statistics and compare them to see if any improvements were found.
Data Results: The five statistics used are as follows:
- - - days = Days to Complete Project
- - - s1 = Money per Day Spent
- - - s2 = Money per LOC
- - - s3 = Days per LOC
- - - s4 = Average time spent IDLE for a team/person
Before learning:
- - - days = 269
- - - s1 = 1240
- - - s2 = 10.25
- - - s3 = 0.0083
- - - s4 = 0.5004
After learning:
- - - days = 268
- - - s1 = 1242
- - - s2 = 10.22
- - - s3 = 0.0082
- - - s4 = 0.4001
Brookes Law: Adding members to the project at a late phase in the game will only make it later. We test this in POM by allowing team/persons to gain experience and become better coders the more they work on the project. We test the effects and prove brookes law by running POM 35 times and gathering the number of days it takes, when team/persons can be added at different phases during the completion of the project. The following chart depicts the results, and indicates a steady increase in the days when members can be added earlier in the development.
http://i.imgur.com/frqkH.png
Y Axis: Days
X Axis: (0 to 100%) Percent of the Project Completed (Teams/Persons can only be added to the project when it is this much complete)
Thursday, July 12, 2012
Wednesday, July 11, 2012
To-Do List:
- Summer Report 3: researching MOEA performance metrics, testing NIS active breeding pool updating, new performance metrics?
- Summer Report 4: researching nicheing techniques, testing new idea for nicheing technique against those in literature, new MOEA?
- Thesis: compiling summer research results into a thesis
- Paper? I'm pretty sure that my Non-dominated Insertion Sort will make MOEAs converge faster. I think that the algorithm running times are worth publication on their own. If it also accelerates convergence, I think the resulting algorithm could be called NSGA-III (or NISGA).
- Prepare for job hunt: After this, I'd like to prepare for getting a job. I'd like to do some research that can relate to landing a data mining or game coding job.
Jared Update
**UPDATED**
Notes:
Dominance eastwest heuristic worked well
splitting while y decreasing was very prone to wacky results (some clusters of 10, some of 2)
next up:
reorganize and rethink code (very hard to SA on both models and real data as is)
get some/any pareto graph out for a model
DE & GA
Notes:
Dominance eastwest heuristic worked well
splitting while y decreasing was very prone to wacky results (some clusters of 10, some of 2)
next up:
reorganize and rethink code (very hard to SA on both models and real data as is)
get some/any pareto graph out for a model
DE & GA
Erin's update
To Dos
With paper details
Slope as Estimator of Cumulative Rule Percentages
These charts show the cumulative rule percentages for Atrazine and Bromacil. There is a graph displaying all of the rules for both chemicals. The other graphs are an example of using the slope of the cumulative rule percentage to estimate the rule percentage in a later round of experimentation. The 'A' rule set is used for both examples.
The example shows that the slope of the line in early rounds, 6 for Atrazine and 3 for Bromacil, provides a good estimate that could allow experimenters to jump forward in the aptamer discovery process by several rounds
With paper details
Slope as Estimator of Cumulative Rule Percentages
These charts show the cumulative rule percentages for Atrazine and Bromacil. There is a graph displaying all of the rules for both chemicals. The other graphs are an example of using the slope of the cumulative rule percentage to estimate the rule percentage in a later round of experimentation. The 'A' rule set is used for both examples.
The example shows that the slope of the line in early rounds, 6 for Atrazine and 3 for Bromacil, provides a good estimate that could allow experimenters to jump forward in the aptamer discovery process by several rounds
Tuesday, July 10, 2012
Tuesday, June 26, 2012
Jared To do
To do:
Easiest.
show perpendicular split in clustering graph (purely cosmetic)
Min and max on 1st pass
analyze non-numerical values
Dominance between eastwest heuristic
implement splitting while y is decreasing
SA on clusters
read in csv data files
get results on real data
get pareto frontier graphs
Code DE
Maybe try standard genetic algorithms
create baseline or benchmark to test against
Hardest
Easiest.
show perpendicular split in clustering graph (purely cosmetic)
Min and max on 1st pass
analyze non-numerical values
Dominance between eastwest heuristic
implement splitting while y is decreasing
SA on clusters
read in csv data files
get results on real data
get pareto frontier graphs
Code DE
Maybe try standard genetic algorithms
create baseline or benchmark to test against
Hardest
Thursday, June 21, 2012
Jared Update
- Updated Models
- Plotting Models instead of random points
- Normalized data in table 0 to 1 for all dimensions

- Q's dealing with simulated annealing on clusters
Tuesday, June 19, 2012
update on recursive clustering
Whats different in the code:
- Cluster class, reorganized the code, now captures the points in each cluster
- changed for multidimension (hopefully)
- few more shortcuts in code
- clusters until root n (initial tests of "while y decreases" turned out bad)

Cluster:
[96, 5]
[88, 17]
[93, 24]
[63, 49]
[93, 52]
[97, 54]
Cluster:
[71, 55]
[71, 57]
[93, 64]
[88, 68]
[92, 74]
Cluster:
[94, 2]
[83, 14]
[78, 14]
[62, 21]
[62, 34]
[59, 39]
Cluster:
[51, 34]
[51, 35]
[37, 28]
[30, 10]
[19, 26]
Cluster:
[18, 95]
[18, 85]
[32, 84]
[34, 64]
[41, 71]
[45, 55]
Cluster:
[61, 76]
[63, 75]
[70, 82]
[82, 88]
[82, 83]
Cluster:
[1, 20]
[2, 33]
[0, 37]
[2, 39]
[5, 41]
Cluster:
[19, 46]
[9, 49]
[7, 57]
[1, 61]
[1, 63]
Friday, June 15, 2012
Atrazine Target Rough Results
Rough tree on Atrazine Target (final selection round)
Created by using the FP-Tree prefix tree algorithm. Not complete.
DNA Words, Atrazine Target Trends
Words that either increase or decrease during selection rounds.
Thursday, June 14, 2012
Recursive Clustering Algorithm
Example 1

Example 2

Things to Note:
- Thickest blue line is first east-west, lines get thinner as the split recursively
- Implemented on 50 random points between (0, 0) and (100, 100)
- Set to 3 recursive splits (8 clusters of 6 or 7 points)
Things to Do:
- Ascii Tree of clusters
- Docs for program
- Implement w/ Models (should be very easy)
- Optimize for more than two dimensions
- Make decisions on most interesting clusters (genetic algorithm, differential evolution, or simulated annealing)
- Implement possible heuristics?
Q's:
- To keep median point? As of right now it assigns to the higher upper half
- Size of clusters to aim for? or number of times recursed?
Wednesday, June 13, 2012
Tuesday, June 12, 2012
Hypothesis 1: Top 25% words from loops FS will best define aptamers.
ie, Informed FSS better than random
Corollary: Random subsets in general will not do well.
1a: Aptamers are not homogeneous and will therefore have multiple groupings within
Hypothesis 2: Aptamers will fall into clusters. Some, but not all, non-aptamers will be outliers and cause error rate to rise. The highest classification error rate will occur in the earliest rounds.
-----------------------------------------------------------------------------------------------------------------------------------
Paper 1 CREATE BENCHMARK, establish that the chosen fss and clusters are accurate for aptamers
Find Representative FSS and CLUSTERS for Aptamers
FIND best FSS and clusters for Full Aptamer DB
LABEL data with best clustering for that subset
TEST with classification accuracy of classifiers
RANK the sets on lowest classification error
P2 APPLY REPRESENTATIVE FSS AND CLUSTERS TO ROUNDS DATA
Apply fss's and centroids to rounds data as a way to discriminate between rounds
Use accuracy or number of additional clusters as measurement of non-aptamers
issues/questions
HOW TO EVAL FSS/CLUSTERS?
how many clusters? or best one?
HOW DO THE OUTLYING INSTANCES INTEGRATE WITH EXISTING
CLUSTERS? new cluster? error?
----------------------------------------------------------------------------------------------------------------------------------
KNOW
Aptamer Db does not easily split and tree. Hard to cluster and j48 not good for classifying
NAIVE BAYES EXCELLENT CLASSIFICATION, JRip, on it's heels with 7-20 rules. 80-90s %
nb > jrip > j48 > decision table >> oneR > zeroR
INFERENCE: Aptamer db follows a predictable distribution. Which one??
IMPLICATION: Use a probabilistic clusterer? ?Try to determine distribution and use goodness of fit for rounds???
Clusters of 10ish+ on Rounds data start to identify areas that are pure.
Both are highly represented in one big cluster.
Need better discriminator.
Full Ellington DB will not cluster
MUST FSS
Reversed strings do differ from it's forward counterpart
Association rules are mostly for one cluster, the one that is all zeros.
So, at it's current configuration - crap
?Would the rules generated from the loops db be valuable???
----------------------------------------------------------------------------------------------------------------------------------
HAVE
Constructed multiple smart and random subsets
and have stats on them
Don't have rig completed to test all fss, clusters, classify
- wanted to explore to make sure this could work before running big experiment
Read Research papers
Word occurance
Using association rules for clustering
DB: Full Ellington DNA Aptamer
Loop DB subset
Two sets of Rounds data with 4-6 rounds of 30 ish instances
Monday, June 11, 2012
Active Learning on Defect Paper
I ran all the data sets through weka's Bayes and Random Forest learners. The g-values produced by weka are very close to the g-values given by my implementation, but I still kept the g-values of weka. The figures are placed together in an under-construction version of the paper.
Monday, May 21, 2012
Rapid recursive spectral learning (RRSL):
Executive summary:
- For our current rig, we have a new optimizer that does interesting things for 2-d goals.
- If we added more dimensions to the goals, then we'd may some really interesting results.
- Abdel:
- We need those distributions for size, effort, defects, have we done this before. That would blow us out to 6-d.
- We need to baseline this against something else. GAs? DEs?
Rapid recursive spectral learning (RRSL):
- A spectral learner learns important parameters by reflecting over training data’s eigenvectors.
- If applied recursively, this approach generates a tree of clusters where each split is defined in terms of the principle component of the data at that level of the tree .
- Traditional recursive spectral learners are slow since the matrix calculations of PCA take polynomial time. Our rapid RRSL algorithm splits data on parameters found by a very fast Nyström approximation [1].
- Any any level in the recursion, RRSL finds two distant points then divides the data on the median position between them. RRSL checks if one these two points dominates the other. If so, then it prunes the dominated half of the data.
- For each leaf cluster generated after domination pruning, RRSL sorts attribute ranges according to how much more frequently they occur in the leaf cluster (compared to the rest of the data). RRSL then generates contrast rules from the first i-th items in that sort. The rules are then applied to data not used in training.
For example:
Recursive spectral learning
Here's RRSL working of a 2-d objective space from feature maps (the goal is most features with fewest violations). In the following:- the thickest black line is the first found dimension
- each thinner line represents a binary split of some thicker line.

Domination pruning
After applying domination pruning, we only get the following eight classes:
Range sorting
When RRSL took one of the above clusters and sorted attribute ranges (bu how more often it appears in that cluster vs anything else), we get the following (this list is sorted most important at the top to least important at the bottom).(Aside: Curiously most of the advise is about what not to do.)(_ID_192 0)
(REGISTRATION_ENFORCEMENT 1)
(REGISTRATION 1)
(_ID_14 1)
(_ID_13 1)
(CUSTOMER_PREFERENCES 0)
(WISH_LIST_CONTENT 0)
(SHIPPING_OPTIONS 0)
(_ID_92 0)
(_ID_193 0)
(_ID_237 0)
(_ID_89 0)
(_ID_226 0)
(_ID_73 0)
(PERMISSIONS 0)
(_ID_191 0)
(_ID_233 0)
(_ID_194 0)
(_ID_187 0)
(_ID_186 0)
(_ID_190 0)
(_ID_189 0)
(PREVIOUSLY_VISITED_PAGES 0)
(_ID_196 0)
(DISCOUNTS 0)
(_ID_239 0)
(_ID_76 0)
(_ID_90 0)
(_ID_75 0)
(_ID_68 0)
(_ID_77 0)
(TARGETING_CRITERIA_PREVIOUS_PURCHASES 0)
(WISH_LIST 0)
(_ID_53 0)
(_ID_235 0)
(_ID_236 0)
(_ID_88 0)
(_ID_91 0)
(_ID_66 0)
(EMAIL_WISH_LIST 0)
(_ID_69 0)
Contrast set rule testing
If we build rules using the first "x" items in the above list, then generate 10,000 more projects (rejecting any that contradict the rules), we get the following effects.
Note that
- After the first 16 items shown above, further changes become mostly noise.
- In terms of max features with least violations, 6 changes look most interesting.
References
[1] John C. Platt, FastMap, MetricMap, and Landmark MDS are all Nyström Algorithms, Proceedings 10th In. Workshop on Artificial Intelligence and Statistics, 2005..
Tuesday, May 15, 2012
Forbes on DM
A plethora of articles on DM from Forbes.
http://www.forbes.com/special-report/data-driven.html
http://www.forbes.com/special-report/data-driven.html
Tuesday, April 24, 2012
What does zero test tell us about the SEE world?
Here is a detailed report using the Blom correction.
Monday, April 23, 2012
Some PCG Algorithms for Dungeon Generation
Recursive Backtracker Maze Algorithm:
- Go in random unvisited direction and backtrack when each direction is visited until everything is visited
Jar Demo:
http://dl.dropbox.com/u/30075723/joe/RecursiveBacktracker.jar
Jamis Buck Maze Algorithm:
- Similar to Recursive Backtracker
- Addition of some parameters that control bias of turning
Jar Demo:
http://dl.dropbox.com/u/30075723/joe/JamisBuck.jar
Recursive Backtracker (left) versus Jamis Buck (right)
http://www.grabilla.com/02418-29fad28b-4a20-45c7-ab57-6da5bd11f1e5.png
Cellular Automata:
- Change the state of a grid cell (whether it can be walked on or not) based on neighboring states
- If (parameter_above = 5) or more of neighbors are "walkable" then this cell is walkable.
- If (parameter_under = 2) or less of neighbors are NOT "walkable" this this cell is non-walkable.
- Run the above to "erode" the dungeon
- No guarantee of connectedness without further work
Examples of Cellular Automata:
http://www.grabilla.com/02418-3a42a206-b903-439f-986a-55f0b6cb5794.png
http://www.grabilla.com/02418-bfaf95c7-f212-4d47-b5ca-e78217c8a7d8.png
Jar Demo:
http://dl.dropbox.com/u/30075723/joe/CellularAutomata.jar
BSP Tree (Binary Space Partion):
- Split the component in half either vertically or horizontally at some position
- Recurse into each half and repeat until the components are "small enough"
- Add rooms to each resulting component after tree is generated
- Connect rooms (by connecting each component to its sibling)
- Connectedness *is* guaranteed as a property of the BSP Tree
Examples of BSP Tree Dungeons:
http://www.grabilla.com/02418-eab66c9e-2e3b-402a-89df-fcb6ff589c6c.png
http://www.grabilla.com/02418-f73cd867-ae67-4f96-8ad9-861cfee997d6.png
Jar Demo:
http://dl.dropbox.com/u/30075723/joe/BSPTree.jar
- Go in random unvisited direction and backtrack when each direction is visited until everything is visited
Jar Demo:
http://dl.dropbox.com/u/30075723/joe/RecursiveBacktracker.jar
Jamis Buck Maze Algorithm:
- Similar to Recursive Backtracker
- Addition of some parameters that control bias of turning
Jar Demo:
http://dl.dropbox.com/u/30075723/joe/JamisBuck.jar
Recursive Backtracker (left) versus Jamis Buck (right)
http://www.grabilla.com/02418-29fad28b-4a20-45c7-ab57-6da5bd11f1e5.png
Cellular Automata:
- Change the state of a grid cell (whether it can be walked on or not) based on neighboring states
- If (parameter_above = 5) or more of neighbors are "walkable" then this cell is walkable.
- If (parameter_under = 2) or less of neighbors are NOT "walkable" this this cell is non-walkable.
- Run the above to "erode" the dungeon
- No guarantee of connectedness without further work
Examples of Cellular Automata:
http://www.grabilla.com/02418-3a42a206-b903-439f-986a-55f0b6cb5794.png
http://www.grabilla.com/02418-bfaf95c7-f212-4d47-b5ca-e78217c8a7d8.png
Jar Demo:
http://dl.dropbox.com/u/30075723/joe/CellularAutomata.jar
BSP Tree (Binary Space Partion):
- Split the component in half either vertically or horizontally at some position
- Recurse into each half and repeat until the components are "small enough"
- Add rooms to each resulting component after tree is generated
- Connect rooms (by connecting each component to its sibling)
- Connectedness *is* guaranteed as a property of the BSP Tree
Examples of BSP Tree Dungeons:
http://www.grabilla.com/02418-eab66c9e-2e3b-402a-89df-fcb6ff589c6c.png
http://www.grabilla.com/02418-f73cd867-ae67-4f96-8ad9-861cfee997d6.png
Jar Demo:
http://dl.dropbox.com/u/30075723/joe/BSPTree.jar
Tuesday, April 17, 2012
Current Status of Papers
In the Pipeline
- Active learning paper
- Bias variance paper
- LOC comparison paper
- Theoretical Maximum Prediction Accuracy paper
- Active learning for defect
- Tukutuku paper

Tuesday, March 20, 2012
LOC-compensation Paper
The latest version of the paper is here. There is still a lot of polishing to do, but the general frame of the paper tells our story (particularly the abstract).
Monday, March 19, 2012
IDEA PROMISE12
ABSTRACT
Background: Most software effort estimation research focuses on methods that produce the most accurate models but very little focuses on methods of mapping those models to business needs.
Aim: Rather than focusing only on algorithm mining, placing the main spotlight on the learner, here we focus on techniques to apply the model in the real world as well. We propose an algorithm called IDEA which creates a dendrogram that can be used to base project parameters decisions to optimize results.
Method: IDEA is compared to 90 solo-methods on 20 datasets using median MRE values. We also show worked examples of how to apply IDEA’s results to project parameter decisions.
Results: By applying IDEA to software effort estimation datasets we generate dendrograms used to make project parameter choices. IDEA does better than most methods 15% of the time, it does just as good as any other method 30% of the time, 35% of the time it does as good as half and 20% of the time it’s in the middle.
Conclusion: IDEA is a linear-time algorithm which can be used effectively to facilitate project decisions and is comparable or better than at least 90 solo-methods tested on 20 effort datasets found in the literature.
Game Surveys
Survey for "League of Legends" now open.
- 69 Results so far, still early in the week.
Survey is here:
http://www.esurveyspro.com/Survey.aspx?id=5cd0fddb-2e5c-451f-bd1e-4dd49e571a1d
Tuesday, March 13, 2012


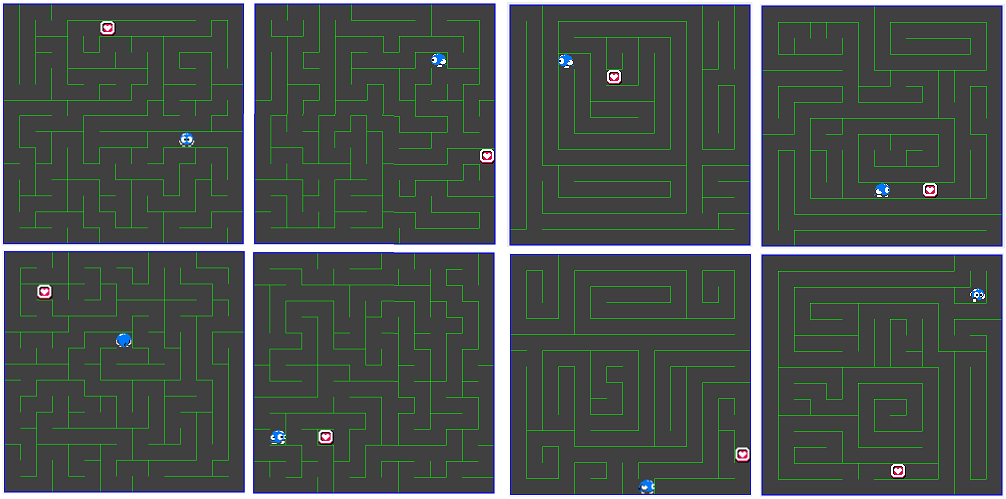
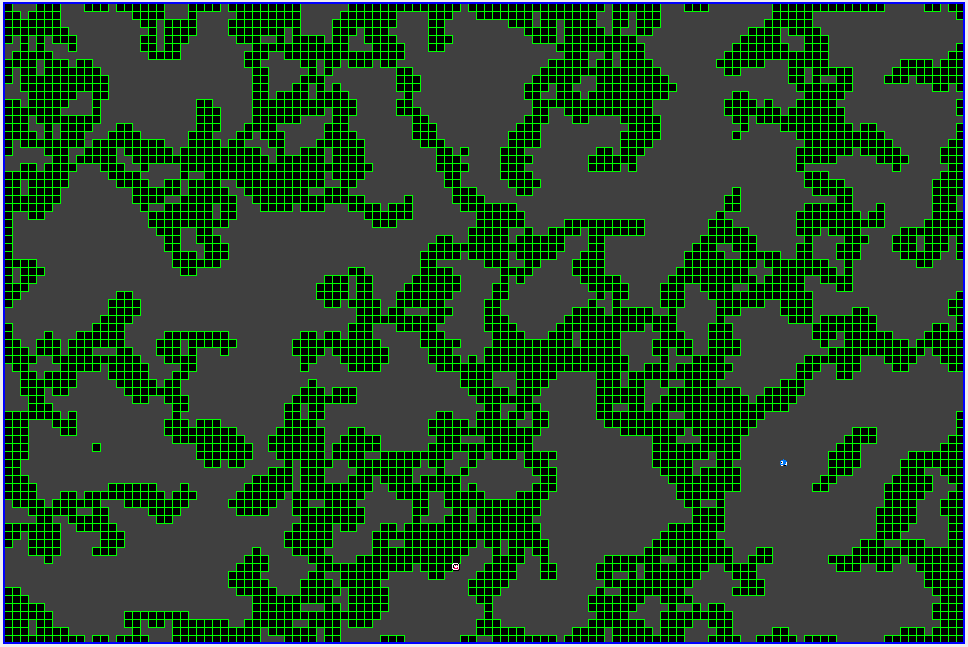
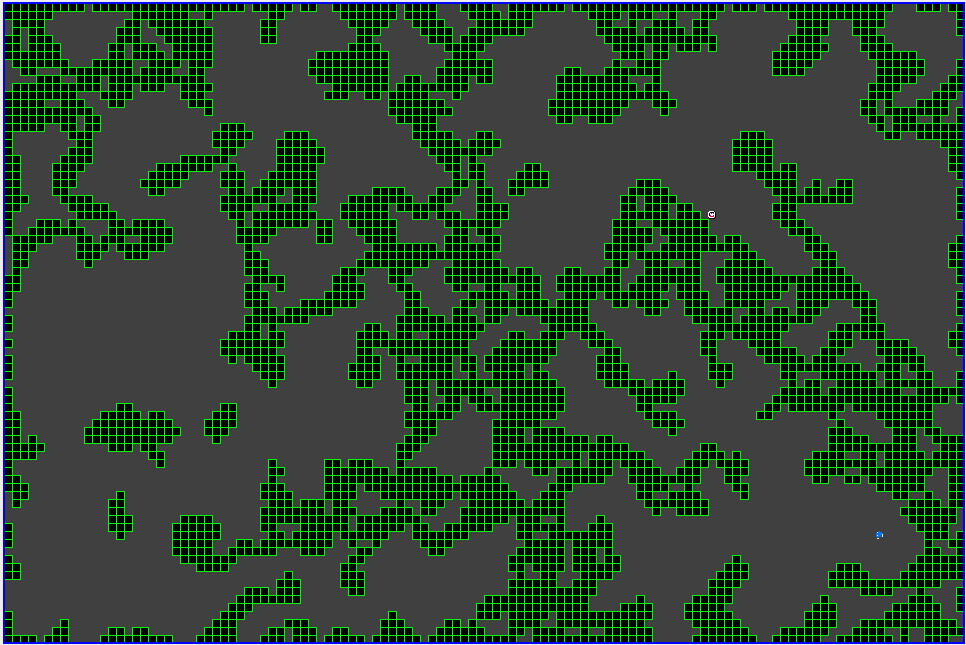

Idea updates
Modified code to include all Datasets for median plot
http://unbox.org/stuff/var/ray/Plotting/Quartiles/medians.pdfIQR charts for 6 datasets
Dendrograms for all datasets, questions
Monday, March 12, 2012
Grammatech Report
Saturday, March 10, 2012
very fast multiple objective optimization?
This paper
- Ostrouchov, G.; Samatova, N.F.; , "On FastMap and the convex hull of multivariate data: toward fast and robust dimension reduction," Pattern Analysis and Machine Intelligence, IEEE Transactions on , vol.27, no.8, pp.1340-1343, Aug. 2005 doi: 10.1109/TPAMI.2005.164 URL: http://ieeexplore.ieee.org/stamp/stamp.jsp?tp=&arnumber=1453521&isnumber=31215
- Says that "FastMap is a dimension reduction technique that operates on distances between objects. Although only distances are used, implicitly the technique assumes that the objects are points in a p-dimensional Euclidean space. It selects a sequence of k ≤ p orthogonal axes defined by distant pairs of points (called pivots) and computes the projection of the points onto the orthogonal axes. We show that FastMap uses only the outer envelope of a data set. Pivots are taken from the faces, usually vertices, of the convex hull of the datapoints in the original implicit Euclidean space."
That is, the pivots found by Fastmap map out vertexes in the the convex hull (the minimum polygon that contain all points)
Now they don't go the next step (which I think is obvious). To do multi-objective optimization,

- generate candidates
- apply recursive divisive clustering with fastmap, keeping track of all the pviots found along the way
- apply pareto domination to just the pivots, deleting the dominated ones
- use the survivors as parents for the GAs or DEs
- loop
Also, this could be a cache for on-line multi-objective optimization.
- find 1000 examples, recursively cluster them with fastmap.
- Set "important" to be the pivots found in this process
- 1000 times
- find one more example.
- if it falls between pivots, ignore it. else, add it to "important"
- Recursively cluster the important points.
- Set a new "important" set to be the pivots found in this process
- Goto step 2
- Apply the above on-line learner
- When pivots are created, ask an oracle for the value of those pivots.
- And check for domination between each pivot pair
- Only ask the oracle for pivot values
- Watch for new arrivals if they fall outside of a pivot pair
- Only ask the oracle for score on instances that fall outside the pair.
- Check them for domination against the non-dominated 2 pivot pairs
- Forget them if they are dominated
- Else, add them to that "important" set
- Every (say) 1000 instances,
- Forget everything except the non-dominated pivots and the non-dominated newbies.
- Rebuild the cluster tree
Subscribe to:
Posts (Atom)