Results 1/21/14
Results of A/B/C/D prediction: dismal
Results 2:
Back to the CSV: class names are listed
Type A: 4% B: 11% C: 12% D: 71% NoMatch: 0%
Type A: 3% B: 17% C: 8% D: 63% NoMatch: 5%
Type A: 5% B: 5% C: 18% D: 69% NoMatch: 0%
Type A: 17% B: 8% C: 15% D: 58% NoMatch: 0%
['camel-1.0.csv', 'camel-1.2.csv', 'camel-1.4.csv', 'camel-1.6.csv']
Type A: 3% B: 0% C: 22% D: 51% NoMatch: 22%
Type A: 15% B: 18% C: 3% D: 55% NoMatch: 6%
Type A: 9% B: 7% C: 10% D: 71% NoMatch: 1%
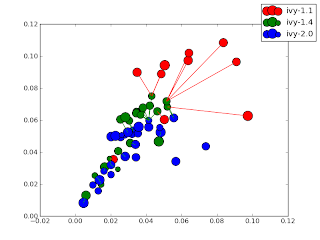
['ivy-1.1.csv', 'ivy-1.4.csv', 'ivy-2.0.csv']
Type A: 7% B: 47% C: 2% D: 40% NoMatch: 1%
Type A: 0% B: 0% C: 0% D: 0% NoMatch: 100%
['jedit-3.2.csv', 'jedit-4.0.csv', 'jedit-4.1.csv', 'jedit-4.2.csv', 'jedit-4.3.csv']
Type A: 17% B: 15% C: 5% D: 58% NoMatch: 2%
Type A: 16% B: 7% C: 9% D: 62% NoMatch: 4%
Type A: 9% B: 15% C: 3% D: 64% NoMatch: 6%
Type A: 0% B: 11% C: 0% D: 47% NoMatch: 38%
['log4j-1.0.csv', 'log4j-1.1.csv', 'log4j-1.2.csv']
Type A: 16% B: 6% C: 8% D: 41% NoMatch: 27%
Type A: 30% B: 1% C: 56% D: 5% NoMatch: 5%
['lucene-2.0.csv', 'lucene-2.2.csv', 'lucene-2.4.csv']
Type A: 33% B: 12% C: 24% D: 28% NoMatch: 1%
Type A: 42% B: 15% C: 21% D: 15% NoMatch: 4%
['synapse-1.0.csv', 'synapse-1.1.csv', 'synapse-1.2.csv']
Type A: 5% B: 4% C: 22% D: 63% NoMatch: 3%
Type A: 13% B: 12% C: 19% D: 53% NoMatch: 1%
['velocity-1.4.csv', 'velocity-1.5.csv', 'velocity-1.6.csv']
Type A: 40% B: 34% C: 2% D: 2% NoMatch: 20%
Type A: 26% B: 37% C: 3% D: 29% NoMatch: 2%
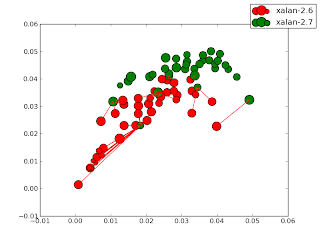
['xalan-2.4.csv', 'xalan-2.5.csv', 'xalan-2.6.csv', 'xalan-2.7.csv']
Type A: 9% B: 4% C: 36% D: 44% NoMatch: 4%
Type A: 27% B: 20% C: 15% D: 31% NoMatch: 4%
Type A: 44% B: 0% C: 51% D: 1% NoMatch: 2%
['xerces-1.2.csv', 'xerces-1.3.csv', 'xerces-1.4.csv']
Type A: 3% B: 11% C: 10% D: 72% NoMatch: 1%
Type A: 7% B: 0% C: 38% D: 25% NoMatch: 27%
Idea: New dataset consisting of:
- All attributes of N
- All attributes of N+1
- The delta between N and N+1
- Class of defect change
Result1
- Preliminary feature selection with info gain selecting top 50%
- Normalized and discredited with Fayyed-Irani
- PCA via FastMap
- Grid clustering
- Centroids plotted along with version n+1 nearest neighbor lines. (Not terribly useful)
- Do I smell transforms of best fit around the corner?
Results0
k-means 5 to cluster each data-set within itself
Eigenvalues used to determine select features with most influance
Actual selected columns are plotted, not synthesized dimensions
-- significant correlations could be reported as synonmyms
rules for connecting the dots?


No comments:
Post a Comment