Monday, August 29, 2011

Which2 Multidimensional optimizer

Immediate results using the given multi-dimensional functions are poor, but promising

Fonseca data


All of our rules with 2-bin discretization using Which were in the tiny green square. However, the goal with fonseca is to minimize, so being in the top right corner is very bad. By comparison, with 8-bin, are rules were mostly in the top right blue square, but we had one rule with coordinates f1=0.2497 f2=0.9575.

In Kursawe


Our rules were all in the mass in the center left when I chose maximize to optimize. With 8-bin, the rules were spread out with than with 2-bin.

This is because 8-bin allows more detail than 2-bin. However, I posit once I am able to recurse this process, applying the constraints of the rules, that 2-bin will be better overall.

Further exploring these rules (by applying the rules as new constraints on the randomized input vectors on the data database) will involve a massive recoding. However, having done some manual constraints using the generated rules, the results improve in Round 2 (treating this as round 1). However, you cannot simply pick one rule to explore. Basically, your unconstrained start point is the head of an infinite tree, the branches from each node are the rules generated by each run of which using that node and all ancestor nodes to that node's rules as constraints on the input data. The rules can then be mapped to coordinates in the space of (f1, f2, ...fn). Ideally, these rules will approach the Pareto frontier.

Which is running through the data very quickly, but until I have further results which will take a massive reworking of code, can't say anything definitive about it's long term usefulness just yet.

Tuesday, August 23, 2011

Privacy Algorithms

4 Privacy algorithms tested against 4 learners (random forests, naive bayes, k-nearest neighbour and logistic regression.

privacy.pdf

what i did on my holidays


think before you report

fayola eg1

fayola eg2

Fastgrid

This summer I worked on creating a stronger version of idea in lisp. The first code was fastmap which was the 2D point generator. Then instead of storing the data in a tree structure, they were stored in a grid structure. The size and number of quadrantas was determined by the square-root of the amount of the data divided by two. When looking to cluster the quadrants, the gridclus function could take a look at all directions surrounding it to find its' closest neighbors.
Then the neighbors of the neighbors were searched for acceptance rate of 0.5 also. Gaps was then coded to compare clusters and locate the closet neighbor feared by the cluster being looked at. Finally, Keys was created to look for the best treatment. It used (b/B)^2/((b/B) +(r/R)) to determine the best rule overall. b is the frequency the rules appears in the 20% best, while r is the frequency that the rule appears in the 80% rest. While all of these functions were coded up individually, they are not yielding the correct results.

As seen from the image, the grid still contains too many clusters. When taking a closer look, it can be seen tath several of tehse clusters should be mereged t into one. The gridclus error is the start of the problems with the different functions interacting.


This example is from the velocity 1.6 data.


There are 30 clusters with the most in one cluster equally 4 quadrants.
An example of the printout when keys is run on this data follows:

KEYS
(CLUSTER AB)
(ENVIES AL)
(TREATMENT #((0.0 $MOA)))
KEYS
(CLUSTER AL)
(ENVIES AZ)
(TREATMENT #((0.0 $NOC)))
KEYS
(CLUSTER AG)
(ENVIES AB)
(TREATMENT #((0.0 $LCOM)))


Monday, August 22, 2011

Lua Games


Over the summer, I worked on and developed three games in Lua. The game concepts come out of the book; Land of Lisp.

Attack of the Robots
- Avoid robots, and as they chase you down, get them to run into each other

Grand Theft Wumpus
- The Wumpus is hiding in Congestion City, but where?
- Use clues to track down his blood trail, and avoid Glow-worm gangs and Police
- Fire your one and only shot at the Wumpus if you think you've got his location tracked down

Evolution
- Watch as animals reproduce while eating and expanding across the game world
- Notice how most animals will remain in the lush jungle; very few wander out across the steppes.

Graphics Engine chosen for development was Lua LOVE: http://love2d.org/


Dungeon Gen & Explorer

Dungeon built based off an algorithm by Jamis Buck:http://blog.kromatyk.fr/wp-content/random-dungeon-design.pdf.

The agent doing the exploring is what is interesting in the Dungeon Project - I developed an algorithm on my own in which the agent discovers and uses pathfinding to track down "darkways" - points of interest which the agent wants to go explore. The algorithm marks down all darkways, and chooses the closest one to go explore.

This is a human-way of exploring an unknown dungeon, and it is human because the agent has been restricted in what it knows about the dungeon. For instance, the agent only knows what has been revealed into vision, and it's pathfinding includes only visible regions.

Left: Regions the agent has explored. Right: The entire dungeon; explored.


Wednesday, June 8, 2011

Scale Up Stability Multiple Datasets


Scale Up Study - so far I've only gone to 2433 datums but I'm planning to combine all of the versions we have with all other sets, which will be ~7400 datums and also to adopt your new report format for these results/new ones. [COMBO] [JEDIT] [XERCES] [LUCENE] [VELOCITY].

Attempted for a neat result, color each dataset and graph them. They're all over the place. Perhaps if I report the majority dataset in each cluster there could be something there.

Here are more stability results for 6 datasets: [HERE]

Tuesday, April 19, 2011

Active Learning Paper

Current version of the paper is here.

Monday, April 18, 2011

Contrast Sets

I've got which2n ported from Will1 for a baseline result. It's spitting out results like THIS.

Also, I've figured out how to embed an on_release event to the matplotlib canvas inside of my wxpython rig so that we can record clicks and display contrasts for selected regions. There will probably be 1,000,000,000 variations of the contrasts that we show (or that the user would like to see. THIS against ALL, THIS against THOSE, THIS against THAT...)

I'm having some issues with which2 and very small sections of instances so the display is waiting on that.


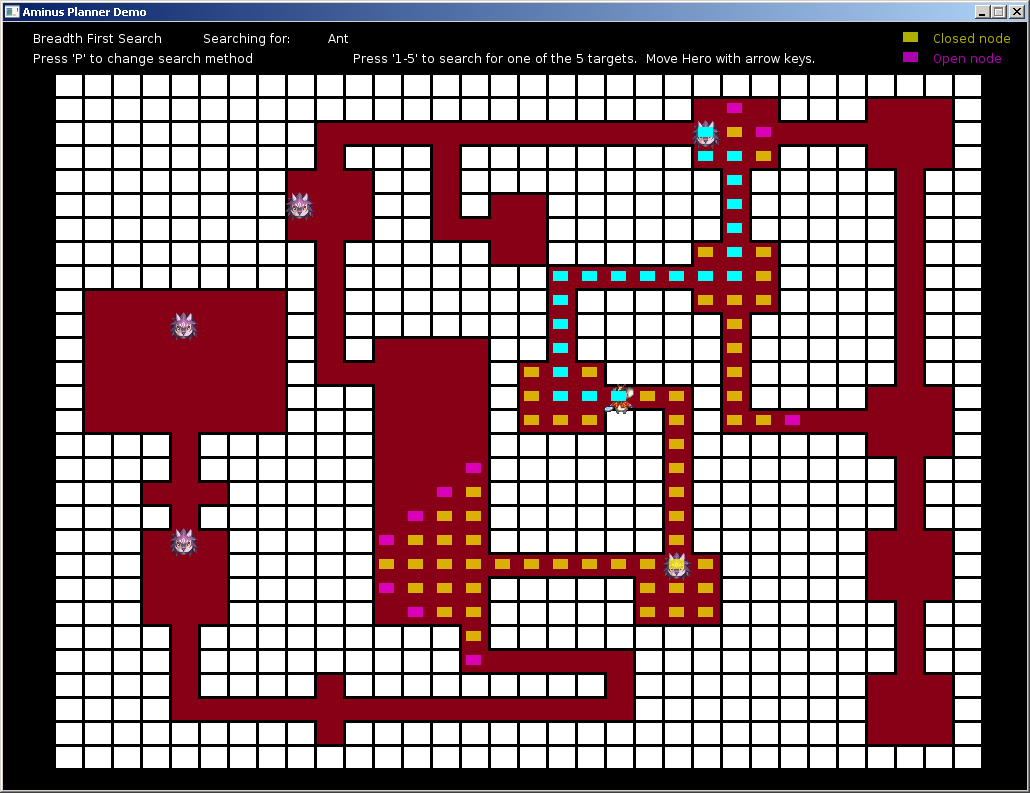
Planner Demo & Lua Search Algorithms


Download demo from here: https://sites.google.com/site/tanzastic/research/planner.love

Need to download LOVE from http://love2d.org, (and install; simple, takes 30 seconds) then you can just double-click to launch planner.love

- Simple demo in lua, using various search methods.
- Map and sprites based on a popular game (that I'm active with.)


Monday, April 11, 2011

Active 1NN vs. Passive&Random 1NN, CART

The plots for 24 datasets are here.

An executive summary of all these plots is here.

Tuesday, April 5, 2011

Histograms and EMD


Taken from Wikipedia, the source of all knowledge and truth:

"The earth mover's distance (EMD) is a measure of the distance between two probability distributions over a region D. Informally, if the distributions are interpreted as two different ways of piling up a certain amount of dirt over the region D, the EMD is the minimum cost of turning one pile into the other; where the cost is assumed to be amount of dirt moved times the distance by which it is moved."


Largest Earth Mover in the world -- German made. 311 feet tall, 705 feet long, 45,000 tons, can move 76, 455 cubic meters each day.


Weka style attribute Histograms (10 bins).


I can compute the EMD of two numeric columns in JM1 (5440 samples) in 0.0035 seconds.

Cliff and Application to Defect Data

Charts for TRUE (defects) class
Charts for FALSE (no defects) class

Sampling methods and Bias-Variance Trade-off

Final version of the bias-variance paper is here.

Tuesday, March 15, 2011

Active Learning via kNN-Based Popularity

The initial results for the active learning are here.
Defect EK Matrix.

http://www.unbox.org/wisp/var/butcher/fromtimm/EK.pdf

Tuesday, March 8, 2011

Some terminology

Something that caused me a lot of time to correct..
When speaking of ABE, instance selection and instance retrieval correspond to entirely different things. Instance selection = filtering, whereas retrieval = analogy selection. Corrected ESEM paper is here.

If only I had perfect experts!

Here is a short report about the results of active learning experiments in effort estimation.
For full plots, refer here.
The moral of the story is:
1) When using 1NN as estimation method, (more or less) half of the instances are not closest neighbor to any other instances.
2) When project instances are labeled by an expert based on their popularity, MdMRE values very easily drop below regular 1NN (with LOO).
3) ASSUMPTION/CHEAT is that the expert perfectly predicts the project effort, which is (probably) never the case.

Monday, March 7, 2011

Even More on Business Intelligence

New runtime chart can be found at this location:


---

Empirical (not fitted) Weibull CDF of the effort distribution w/ you are here in red:


-----

Takes on the 3 shot cycle:


Monday, February 28, 2011

More on Business Intelligence and Other Things

Quadrant Neighborhood

Mann-Whitney reports the following regarding the distributions in the chart below.

Rank Dataset
0 albrecht
0 china
0 coc81
1 cocomo_sdr
1 desharnais_1_1
1 finnish
1 kemerer
1 maxwell
1 nasa93


More on the Bussman9

Nomograms have been implemented for Summarization (and arguably Goals & Benchmarking). The nomogram accepts target classes such as "<> 20000" as an example of bad effort. This allows us to show two parts of the space... The nomogram also indicates where "you are here" lies on the scale.


Overlays


Modeling/Simulation


Trends (needs to be splined)


Alerts

Forecasting

Are there favourite subsets?

Noise injection experiments showed that it is difficult to introduce noise to effort datasets. Then this raised the question: Are certain subsets of the datasets more preferable than the others? To answer that we can look at neighbor-ordering matrices. Two forms of neighbor-ordering are:
* Absolute : here.
* Percentage : here.

Tuesday, February 15, 2011

Business Intelligence & Quadrant Differences Graphed

All of the above can be found HERE.

Results from Noise Generation in Effort Sets

Ran kNN and kNN with Cliff instance selection for k = 1,3,5.

Noise Injection method:

for 10%, 20%,...,80% of train data:
Replace with a randomly selected effort score is not equal to the original value.
Perform similar transform with the top 3 attributes as selected by BORE also ensuring replaced value is not equal to the original value.

Results are MDMRE from 5x5 cross-validation.

albrecht
china
cocomo
desharnais
finnish
isbsg
maxwell
miyazaki94
nasa93

Tuesday, February 8, 2011

Monday, February 7, 2011

Initial BAMBOO Results

http://unbox.org/wisp/var/bill/comba/reports/february/feb8.pdf

Initial results from running BAMBOO are provided in the above file.

Tuesday, February 1, 2011

Results from Active Learning Projects This Week

Comparison between NB, NB+CLiff, and 1NN+Cliff:
http://www.unbox.org/wisp/var/kel/doc/ActiveLearning/CliffResults/1-31/

Comparison between NB treatments:
http://www.unbox.org/wisp/var/kel/doc/ActiveLearning/CliffResults/1-31-2/

Secret mixture?

Is there a secret percentage mixture when selecting instances from your own company and from a cross-company? Find out here.

Friday, January 28, 2011

Open Issues in Empirical SE

Q1: Generality of the Microsoft conclusions?


Q2: How to support the following kinds of business intelligence?


t


Other approaches to business intelligence:


Talk at Microsoft Research, Jan 27, 2011

Talk at Microsoft Research, Jan 27, 2011

Slides (7MB) : http://unbox.org/wisp/var/timm/10/swinburne/bi-v5.pptx

Download (250MB) : http://menzies.us/empiricalSEversion2.wmv


The rapid pace of software development innovation challenges empirical software research to keep up, if it is to deliver actionable and useful results to practitioners. The empirical software engineering research field has not always been able to deliver this. Recently, it has become increasingly apparent that rigorous data collection and analysis can be so expensive and time-consuming that empirical software engineering studies, which seek to understand the costs and benefits of software development solutions in practice, greatly lag the pace of innovation in the field. In too many cases, a trusted body of empirical results can only be built up after the innovative solutions that they are studying are already well on their way to obsolescence or standard practice. However, we argue that recent advances put a sustainable and increased research pace within our reach. A suitably scaled-up and nimble empirical research approach must be based upon the “crowd-sourcing” of tough empirical problems. 


Tuesday, January 25, 2011

Will McBurney

Currently a graduate student in Computer Science at West Virginia University, Will McBurney is a programmer, musician, and blogger on the side. Will McBurney began programming in his Senior year of High School in Charleston, WV, his hometown. Originally attending WVU as an undergraduate aspiring to become a Mechanical Engineer, Will switched majors midway through his freshmen year to Computer Science.

It is not secret Will is a major nerd. Will skipped his Senior Prom to go to National Science Bowl in 2006 and has read more Star Wars books than most people have read at all. On the inter-tubes, Will uses the psuedonym "Death by Smiley", a name that was made up spur of the moment while playing Halo in the dorms at WVU.

-Will McBurney

Active Learning

Kel w/ Cliff:

http://www.unbox.org/wisp/var/kel/doc/cliff/results.txt

Andrew w/ Heuristic Randomness:

Rank Deltas for COMBA

http://unbox.org/wisp/var/bill/comba/reports/rankdeltas.png

Which features define CC?

Division of available datasets into subsets according to different criteria (language, hardware, resource etc.) may define closeness of a cross-company setting. The results and subsets are here.

Bias and Varince of Testing Strategies on Effort Datasets

A short report is here.

Monday, January 24, 2011

Another look at Fayola's data

http://unbox.org/wisp/var/11/pretty/forensics.pdf

map-reduce & Hadoop

Map-Reduce

MapReduce is a patented[1] software framework introduced by Google to support distributed computing on large data sets on clusters of computers.[2]
MapReduce libraries have been written in C++C#ErlangJavaOcamlPythonRubyF#R and other programming languages.


Material for interactive new media design

http://forgottenlegacywwi.org/exhibit.html

popularity is (almost) a perfect predictor for defects


One surprising observation from the Helix study [50] was that(a) most classes are not popular and (b) patterns of the most pop-ular classes emerged very early in the lifetime of an open-sourceproject. Specifically, popularity and age of a class maintain a pos-itive monotonic relationship throughout the lifetime of a system[50], that is, as a system matures, popular classes tend to becomeeven more popular. 

This contradicts our reading of Fowler [20] andBeck’s work [6] that object-oriented quality assurance requires in-volved constant refactoring (e.g., Beck’s TDD loop of write tests,run test, refactor). We cannot see evidence of constant, widespreadrefactoring in open-source projects studied by Helix [50].

The implications of this lack-of-refactoring for the theory of object-oriented development is discussed elsewhere [50]. This paperfocuses of class popularity since (a) it is a stable concept for thelifetime of an object-oriented system and (b) popularity can lead todefects via:

  • Defect injection:As developers work with the popular classes, they make the occasional mistake. Some of these mistakesresult in code defects. Since developers work on popular classes more than other classes, then most developer defects accumulate in the popular classes.
  • Defect discovery: Since developers work mostly on popular classes, they are most likely to uncover those classes’ defects.
We demonstrate that in 33 open-source Java projects popularity-based defect predictors work within 4% of a theoreti-cal upper bound on predictor performance (this is the basis for ourclaim that such predictors are “nearly perfect”).  

empirical SE v2.0

timm, trying to map out a research agenda for the next decade


More on story content generation

http://grandtextauto.org/2008/02/19/ep-52-a-tale-spin-story/

Tuesday, January 18, 2011

What makes a game fun

Hello, hi,

My name is Joe and I'm a new PhD student at WVU, got my MS in CS just last year, and working towards the big goal with a vague idea and a genuine interest for AI in games. I'm hard of hearing, and generally have a tough time understanding people in a group setting, but usually if there's only one person speaking -towards- me, with a good voice, then it's fine. (Sorry if I seem confused sometimes, usually trying to figure out what you just said.)

Last semester I worked on the idea of "What makes a game Fun?" and found myself digging through a lot of unofficial resources towards concepts in a game that heighten the level of enjoyment had by players. I wrote a survey-type paper and outlined what I thought were the core values of "Fun in video games." Those four were Gameplay, Originality, Replayability and Story (GORS). Replayability is key; any time a player picks up a controller, there is a drawing factor that keeps them attracted to the game and continuously replaying. Once that allure is lost, replayability is lost, and the game no longer has potential to provide fun (at least for a while, but there's always a chance the allure returns at some later point - yet another key point to replayabilty.)


Anyway, second half of semester I put the four dimensions of fun together in a game which the user could play and "set" the levels of each dimension. i.e., the user would set originality to be of "low" setting, making item names and enemies sound very generic, as opposed to original and unique. Called Cre-Ativity, the game plays like Zelda, in a top-down fashion developed with OpenGL in C++. Players can use one of four weapons; acquire armor, gain experience, become stronger and bash enemies while exploring in aims of completing a general story-driven quest.

At this point, the semester was over and one of the key questions that remained was; "How could you develop story content according to user-input?" More on that topic to come.


Screenshots:
https://sites.google.com/site/tanzastic/research/s01.jpg
https://sites.google.com/site/tanzastic/research/s02.jpg
https://sites.google.com/site/tanzastic/research/s03.jpg
https://sites.google.com/site/tanzastic/research/s04.jpg
https://sites.google.com/site/tanzastic/research/s05.jpg

Cross vs. Within Company Experiments

Tentative results are here.
Selected cross-company datasets are given below..
finnishAppArea = {'finnishAppArea2','finnishAppArea7','finnishAppArea10'};
finnishAppType = {'finnishAppType1','finnishAppType2345'};
kemererHardware = {'kemererHardware1','kemererHardware23456'};
maxwellAppType = {'maxwellAppType1','maxwellAppType2','maxwellAppType3'};
maxwellHardware = {'maxwellHardware2','maxwellHardware3','maxwellHardware5'};
maxwellSource = {'maxwellSource1','maxwellSource2'};
chinaResource = {'chinaResource1','chinaResource2','chinaResource3','chinaResource4'}

Questions:
Is 1*LOO ok or do I need 20*LOO?
Is using only static-k better? 

Testing using only the X dimension in IDEA

http://www.unbox.org/wisp/var/butcher/dragons/x_validity_test.pdf

New results after discretizing with Fayyad Irani

http://unbox.org/wisp/var/fayola/forensics/results/

This week...

Tim has written two subjects

Learned about map-reduce and clojure and wondered about applying it to WHICH.

Coded up idea, knn, cross-val, and run lots of experiments

Worked with physics on an NSF proposal

Planned next week's talk at microsoft, redmond

Worked with Martin Shepperd on a journal special issue.

Worked with Ayse Bener on a journal special issue

And written a research paper


Over to you....

Tuesday, January 11, 2011